ConsoleLog
Displays errors, warnings, and other messages output through Unity's Debug class. Also, logs added with the NoaConsoleLogAPI are displayed in the list.
Note: Characters not included in the font asset will be displayed with their Unicode representation, excluding the backslash (\).
Screen Layout and Operating Instructions
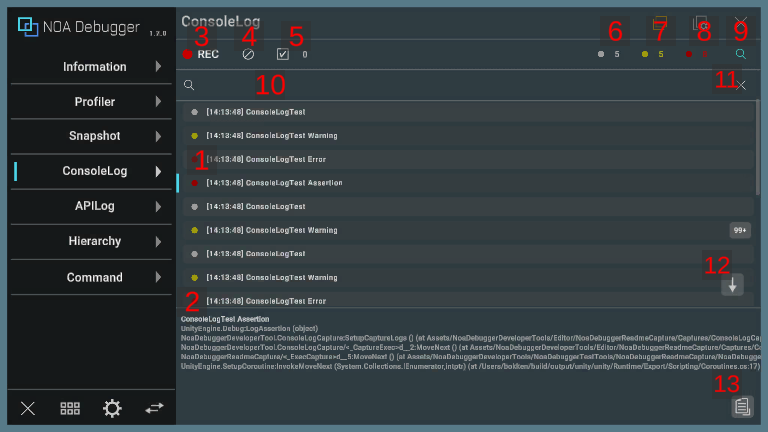
1. Logs
The obtained logs will be displayed. When selected, they are highlighted and their stack traces are displayed in the log details.
By long-pressing Log, the log message will be copied to the clipboard. Pressing Log again while a log is selected will hide the log details.

| Item | Description |
|---|---|
| a. Log Type | Represents the type of the log. Please refer to the information described later for what each color means. |
| b. Output Time | Displays the time when the log was output. |
| c. Text | Displays the log message. |
| d. Number of Logs | Displays the number of consecutive outputs of the same log. For more details, see the information below. |
2. Log Details
Displays the stack trace of the selected log.
Supported Environment
If the setting of Project Settings > Player > Other Settings > Stack Trace is set to "None", the stack trace cannot be displayed.
Also, stack traces other than exceptions cannot be displayed in the following environments:
- Browser applications
- Builds other than IL2CPP or Development
3. Log Collect Button
By pressing the [●REC] button, you can toggle the collection of logs on and off. Logs are collected when the application is started.
The [●REC] button in red means collecting, while white means stopping.
4. Clear Button
By pressing [ ] button, all retained logs will be deleted.
5. Log Selection Toggle
By pressing the [ ] button, you can toggle the log selection mode. For details about the log selection mode, please refer to the information described later. Additionally, the number of selected logs will be displayed.
6. Message Log Toggle
Displays the number of message logs. You can toggle the display and non-display of message logs by pressing the [●] button.
7. Warning Log Toggle
Displays the number of warning logs. You can toggle the display and non-display of warning logs by pressing the [●] button.
8. Error Log Toggle
Displays the number of error logs. You can toggle the display and non-display of error logs by pressing the [●] button.
9. Search Field Display Toggle
By pressing the [ ] button, the search field will be displayed.
10. Search Field
The log will be filtered and displayed based on the text you input. Logs that include the matching text will be displayed.
Note: The information from the stack trace is not included in the search.
11. Clear Search Text Button
By pressing the [×] button, the text entered in the search field will be cleared.
12. Scroll to Bottom Button
By pressing the [↓] button, the log list will be scrolled to the bottom.
Note: If the latest log is being displayed, the scroll-to-bottom button will not be displayed.
13. Copy Button
Pressing the [ ] button copies the contents of the log to the clipboard.
Note: This is the same behavior as long-pressing the log.
Log Selection Mode
Switch to Log Selection Mode using the Log Selection Toggle.
In Log Selection Mode, you can select multiple logs and perform download or send operations on the selected logs.
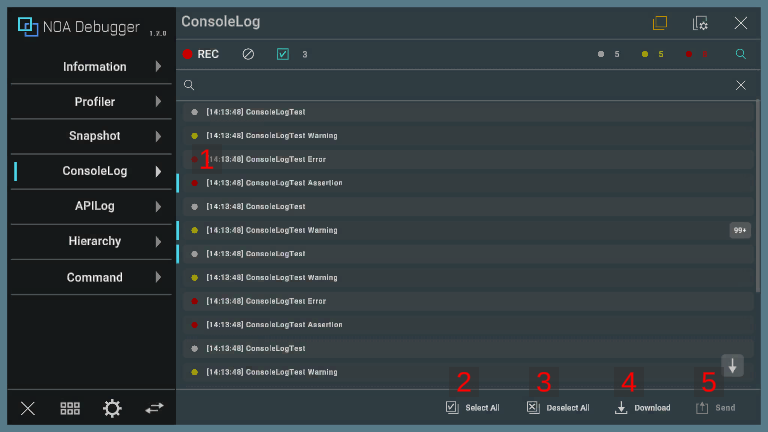
1. Log
Press a log to select the target log.
2. Select All
By pressing the [ Select All] button, select all logs at once.
3. Deselect All
By pressing the [ Deselect All] button, deselect all logs at once.
4. Download Button
By pressing the [ ] button, a dialog to download the selected logs will be displayed. If there is no logs, you cannot press the [] button.
Please refer to About Download for information on the download dialog.
5. Send Button
By pressing the [ Send] button to execute the "OnLogSend" callback. The list of selected logs will be passed as an argument to "OnLogSend". For details on "OnLogSend", refer to API List.
If there is no log information or the callback is not registered, you cannot press the [ Send] button.
Log Types
| Icon Color | Log Type |
|---|---|
 | Represents a message log. |
 | Represents a warning log. |
 | Represents an error log. |
Conditions for treating consecutive logs as the same
When consecutive logs meet the following conditions, they are treated as the same log, and only the number of consecutive outputs is retained:
- Log message matches.
- Stack trace matches.
APIs provided by NOA Debugger
Please refer to the API List for the APIs provided by ConsoleLog.
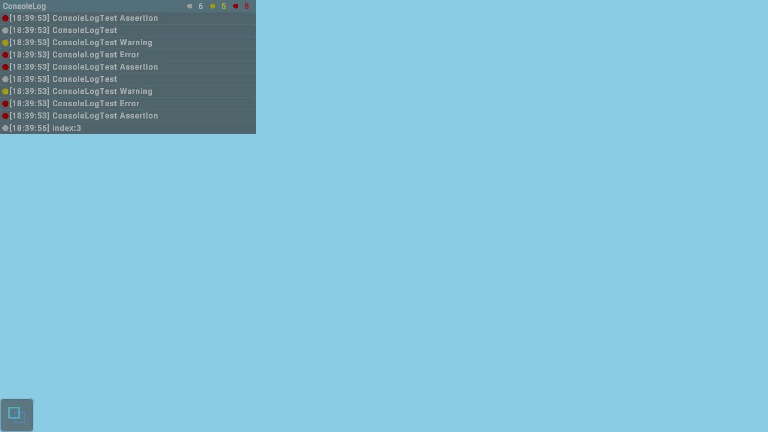
About the Overlay Feature
Screen UI Layout
Settings Screen
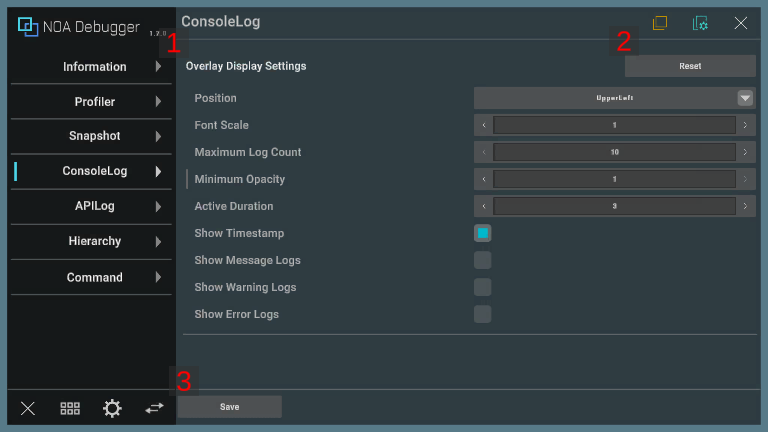
1. Display Settings
When these settings are changed, they will be kept even if you restart the app.
If the values are not retained, the default values specified in Tool Settings will be applied.
| Item | Description |
|---|---|
| Position | Specifies the position of the overlay. |
| Font Scale | Specifies the font scale for overlay logs within a range of 0.5 to 1.5. |
| Maximum Log Count | Specifies the maximum number of log displayed in the overlay, within a range of 10 to 30. |
| Minimum Opacity | Specifies the minimum opacity of the overlay in the range from 0.0 to 1.0 |
| Active Duration | Specifies the active duration of the overlay within a range of 1 to 5 seconds. The overlay will be fade out automatically after the specified number of seconds have elapsed since the last log output. |
| Show Timestamp | Specifies whether to display timestamps in the overlay logs. |
| Show Message Logs | Specifies whether to display message logs on the overlay. |
| Show Warning Logs | Specifies whether to display warning logs on the overlay. |
| Show Error Logs | Specifies whether to display error logs on the overlay. |
2. Reset Button
Pressing the [Reset] button discards the saved settings for the ConsoleLog overlay and applies the default values.
3. Save Button
Pressing the [Save] button saves and applies the changed values.
The [Save] button is displayed only when there are unsaved settings.