Profiler
Profiler displays operations and measurement information for Runtime performance measurement.
Display Items
Explains the information when the Profiler is displayed.
Note: Values that cannot be retrieved depending on the operating environment of the application will show "Not Supported". If no measurement has been made since the application started, the value will be displayed as "-".
FPS
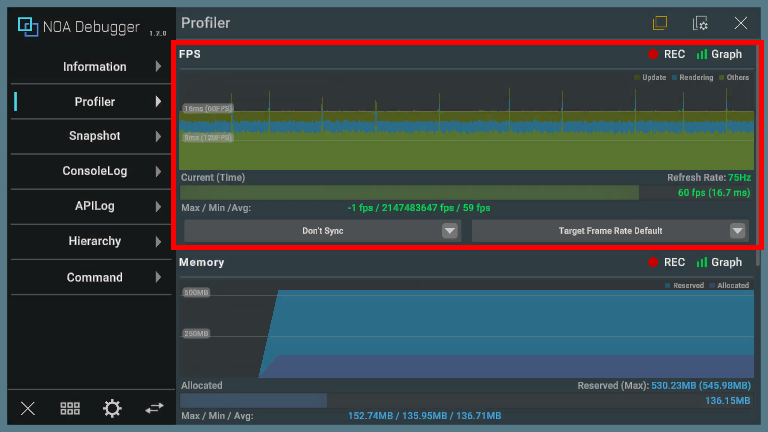
The graph represents the time taken for each frame to process.
| Item | Description |
|---|---|
| Update | The time it took for Update and LateUpdate. |
| Rendering | The time it took for rendering. |
| Others | Time excluding the above. |
Note: It does not have the same precision as the Profiler in the Unity editor. Please use it to identify CPU and GPU bottlenecks.
The content displayed below the graph is as follows.
FPS Value and Elapsed Time
Displays the FPS value as a horizontal bar graph.
The maximum value of the graph is basically set to TargetFrameRate, but if TargetFrameRate is -1, RefreshRate is used instead.
Max / Min / Avg
Displays the maximum/minimum/average FPS value during the measurement period.
VSyncCount Dropdown
You can change the VSyncCount from the dropdown as follows:
- Don't Sync
- Every V Blank
- Every Second V Blank
- Every Third V Blank
- Every Fourth V Blank
For supported platforms, please refer to the official Unity documentation.
TargetFrameRate Dropdown
You can change the TargetFrameRate from the dropdown as follows:
- Target Frame Rate Default
- Target Frame Rate 5
- Target Frame Rate 15
- Target Frame Rate 30
- Target Frame Rate 60
- Target Frame Rate 72
- Target Frame Rate 90
- Target Frame Rate 120
- Target Frame Rate 144
- Target Frame Rate 165
- Target Frame Rate 240
- Target Frame Rate 360
If you specify a value other than the above, the specified value will be temporarily displayed in the dropdown.
For supported platforms, please refer to the official Unity documentation.
Memory
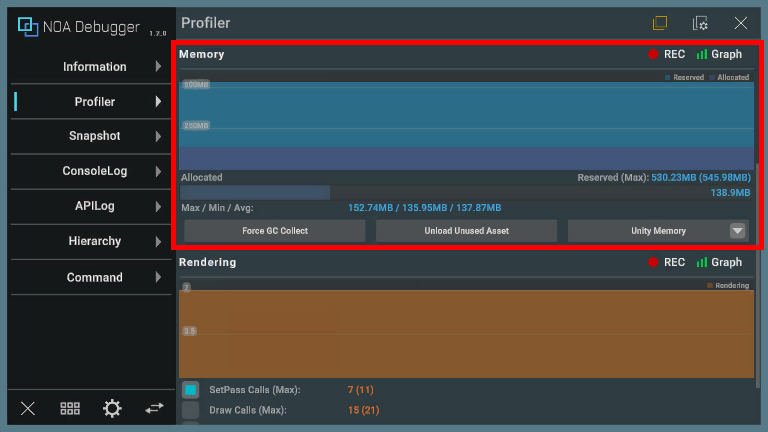
The graph represents the history of measured values over a certain period of time.
The information displayed varies depending on the measurement type.
| Measurement Type | Description |
|---|---|
| Unity Memory | Displays the used and unused memory of the memory allocated by Unity. Note: The total height of the graph represents the amount of memory allocated by Unity. |
| Native Memory | Displays the memory usage obtained from the native API. |
| Mono Memory | Displays the used and unused memory of the managed heap. Note: The total height of the graph represents the amount of memory in the managed heap. |
The content displayed below the graph is as follows.
Memory Usage
Displays memory usage as a horizontal bar graph.
The information displayed varies depending on the measurement type.
| Measurement Type | Item | Description |
|---|---|---|
| Unity Memory | Allocated | Displays the current usage of the memory allocated by Unity. |
| Unity Memory | Reserved(Max) | Displays the current and maximum values of the memory allocated by Unity during the measurement period. |
| Native Memory | Current | Displays the current memory usage obtained from the native API. |
| Native Memory | Total | Displays the maximum memory capacity to be measured. It can be changed from NoaProfiler.TotalNativeMemoryMB, and by default, it is the RAM capacity of the device. |
| Mono Memory | MonoUsed | Displays the current usage of the managed heap. |
| Mono Memory | MonoHeap(Max) | Displays the current and maximum values of the managed heap during the measurement period. |
Max / Min / Avg
Displays the maximum, minimum, and average memory usage during the measurement period.
GC Execution Button
Pressing the [Force GC Collect] button forces garbage collection to be executed.
Note: The [Force GC Collect] button cannot be pressed if garbage collection is disabled by GarbageCollector.GCMode.
Asset Unload Button
Pressing the [Unload Unused Assets] button executes the unloading of unused assets.
Memory Measurement Type Dropdown
You can switch the measurement type from the dropdown.
The measurement type will be kept even if you restart the app.
Unity Memory
Displays the memory usage that Unity can obtain.
This type is selected by default.
Native Memory
Displays a more accurate memory usage, including native-related values that Unity cannot obtain.
The function does not work in browser applications.
Also, on Android devices with OS version 10 and above, the last obtained value is reflected every 5 minutes by default due to processing costs. The interval of memory measurement time can be changed with an ADB command.
adb shell settings put global activity_manager_constants memory_info_throttle_time=1000
The trailing 1000 refers to milliseconds, so with this setting, it can be acquired at 1-second intervals.
The current settings can be checked with the following ADB command.
adb shell dumpsys activity settings | grep memory
Mono Memory
Displays memory usage related to the managed heap.
It works accurately only when a Mono build is performed. otherwise, virtual values are used.
Rendering
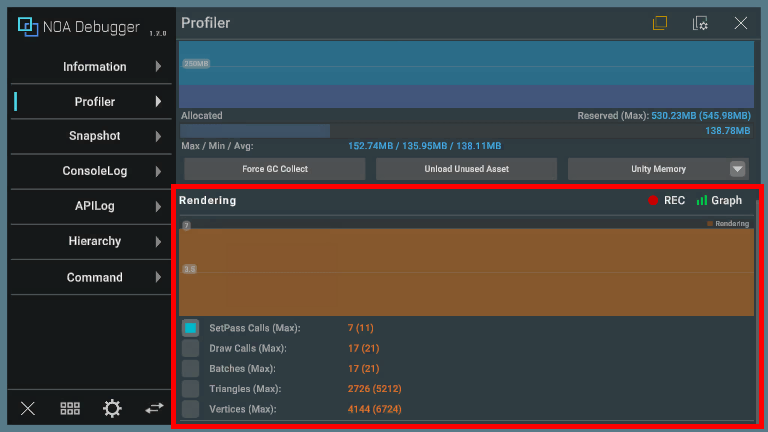
The graph represents the history of measured values per frame for any of the following items.
The selected item will be kept even if you restart the app.
| Item | Description |
|---|---|
| SetPass Calls(Max) | Displays the number of times Unity has switched shader paths used for rendering game objects in the current frame, as well as the maximum value during the measurement period. |
| Draw Calls(Max) | Displays the total number of draw calls sent in the current frame, as well as the maximum value during the measurement period. |
| Batches(Max) | Displays the number of batches processed in the current frame, as well as the maximum value during the measurement period. |
| Triangles(Max) | Displays the number of triangles processed in the current frame, as well as the maximum value during the measurement period. |
| Vertices(Max) | Displays the number of vertices processed in the current frame, as well as the maximum value during the measurement period. |
Common UI
Measurement Button
You can switch the measurement on and off by pressing the [● REC] button. The app starts in measurement mode on the first launch.
The [● REC] button in red means it's measuring, while white means it's stopped.
Note: The measurement button will be grayed out in environments where values cannot be obtained.


When you stop the measurement during the measurement, it keeps the last measured value. Also, the measurement status will be kept even if you restart the app.
Graph Display Button
You can switch the graph display on and off by pressing the [Graph] button. The app starts in a graph display state on the first launch.
The [Graph] button in green means it's displaying the graph, while white means it's hidden.


The graph display state will be kept even if you restart the app.
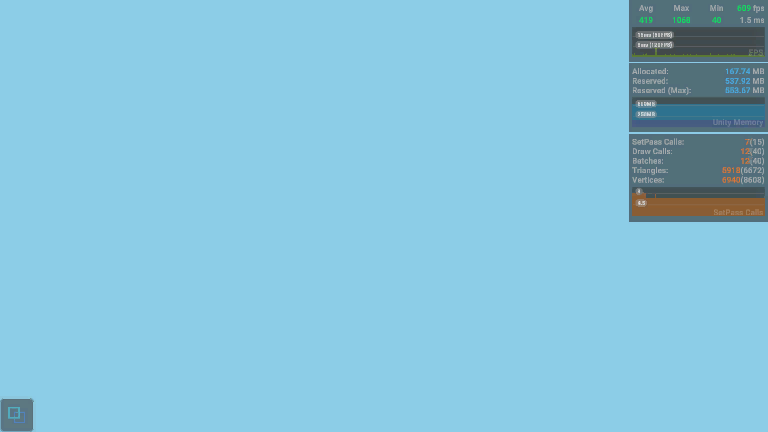
About the Overlay Feature
Screen UI Layout
By default, the Profiler overlay displays the following information.
Changes to display content can be made in the settings screen within the main view.
Settings Screen
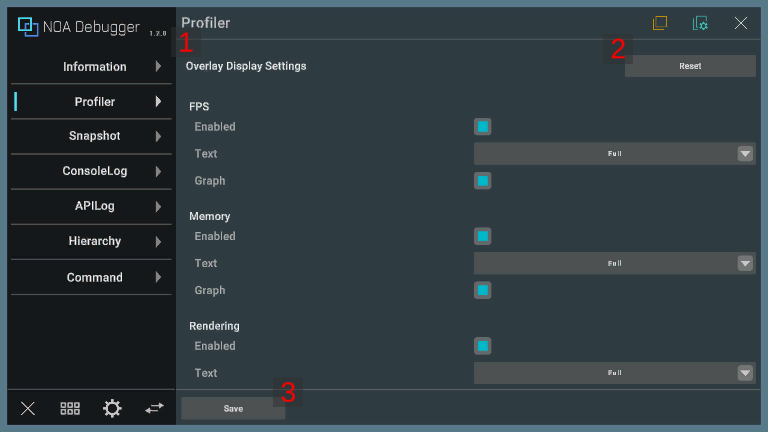
1. Display Settings
When these settings are changed, they will be kept even if you restart the app.
If the values are not retained, the default values specified in Tool Settings will be applied.
Settings for Each Feature
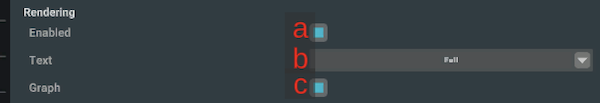
a. Enabled
If on, the overlay for the relevant feature will be displayed.
b. Text
Specify the amount of information displayed as either Simple or Full.
The display information for each setting is as follows:
| Feature | Case Simple | Case Full |
|---|---|---|
| FPS | Displays the current FPS value. | Displays the current, maximum, minimum, average FPS, and elapsed time since the last frame. |
| Memory | Displays the current memory usage of the measurement type selected in the main view. | Displays multiple measurement values of the measurement type selected in the main view. |
| Rendering | Displays the current values of items selected in the main view. | Displays the current and maximum values of all items. |
c. Graph
If on, a graph will be displayed in the overlay.
For Rendering, a graph of the items selected in the main view will be displayed.
Other Settings
| Item | Description |
|---|---|
| Position | Specifies the position of the overlay. |
| Scale | Specifies the scale of the overlay in the range of 0.5 to 1.5. |
| Axis | Specifies the direction when arranging multiple overlays such as FPS and Rendering. |
2. Reset Button
Pressing the [Reset] button discards the saved settings for the Profiler overlay and applies the default values.
3. Save Button
Pressing the [Save] button saves and applies the changed values.
The [Save] button is displayed only when there are unsaved settings.